
I am a data analyst, I graduated from the Department of Electrical Engineering, I am interested in working in the data field, I have a high leadership spirit, think critically, think logically, can work together in teams or individually and have integrity. I am used to working with computers, especially in the field of data (Python, R, SQL, SPSS, Tableau, Power BI, Ms.Office), I have good communication skills and good public speaking. Able to learn something new quickly, and easily adapt to the environment.
Python
R
Tableau
IBM SPSS Statistics
BigQuery
MySQL
Mic.Office
Power BI
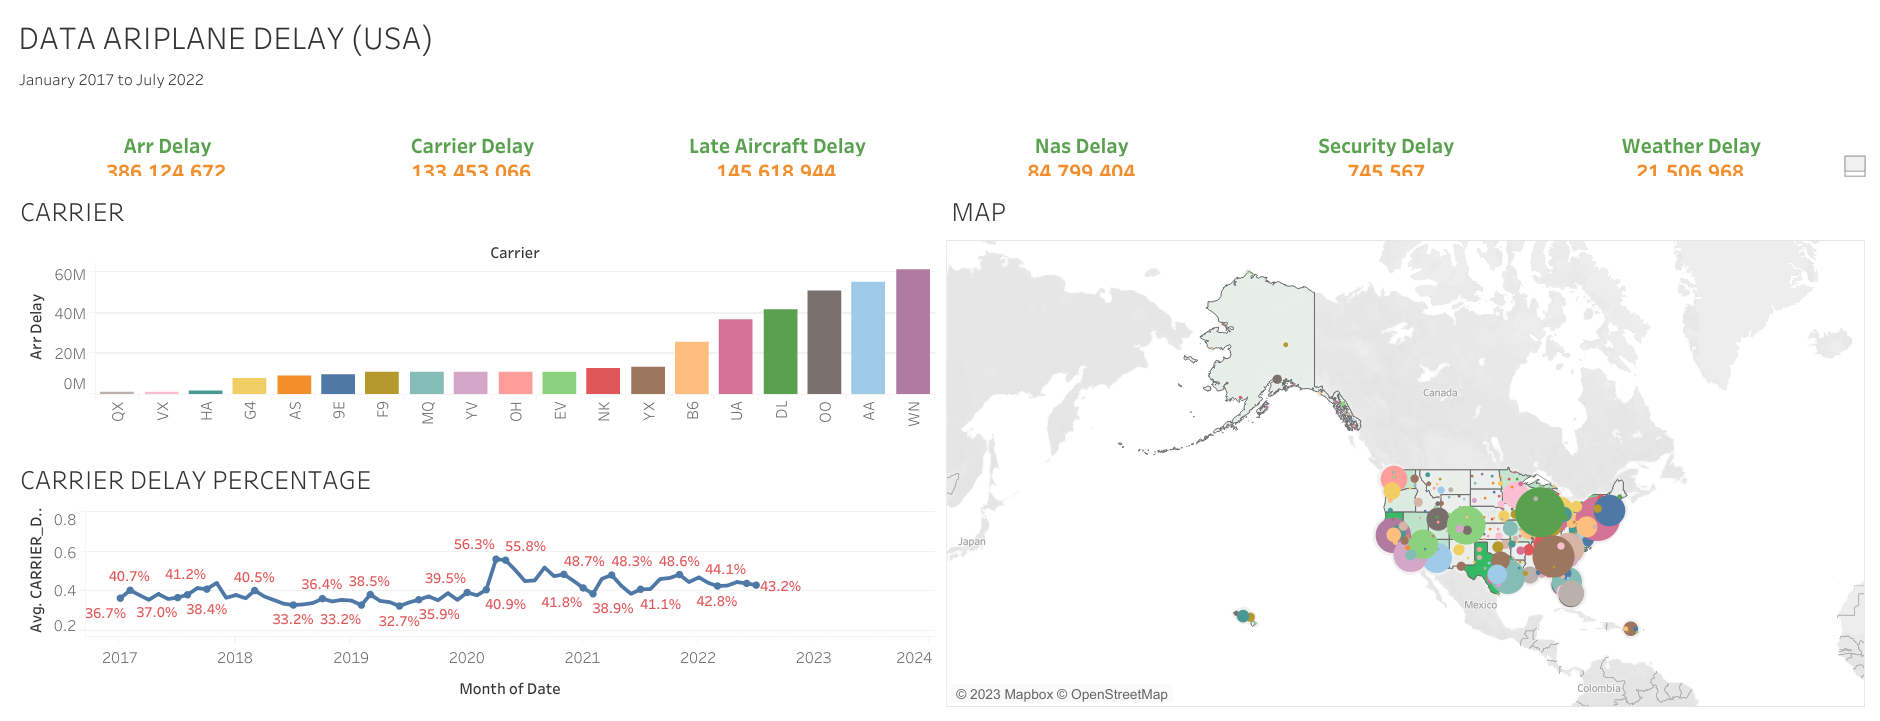
Flight delay data at all airports in the USA, delay data taken in 2017 - 2022, data processed using Microsoft Excel and Python and then visualized using Tableau.
Demo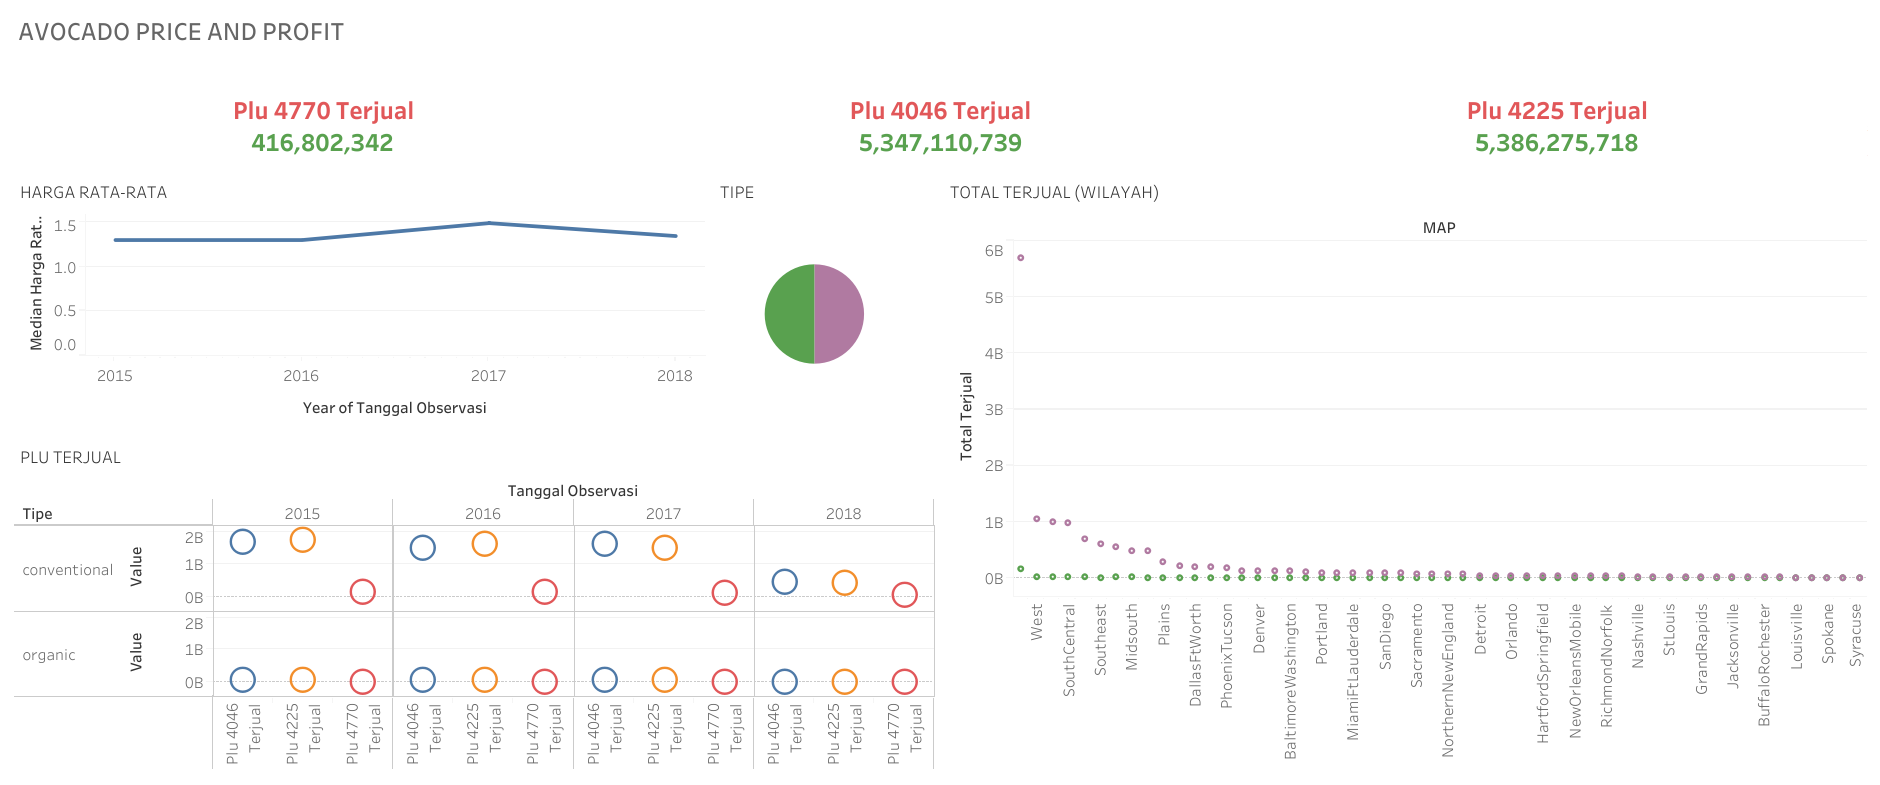
Selling price of avocados with 3 serial numbers in Europe was taken for 2015 - 2018, the data was processed using Microsoft Excel and Python and then visualized using Tableau.
Demo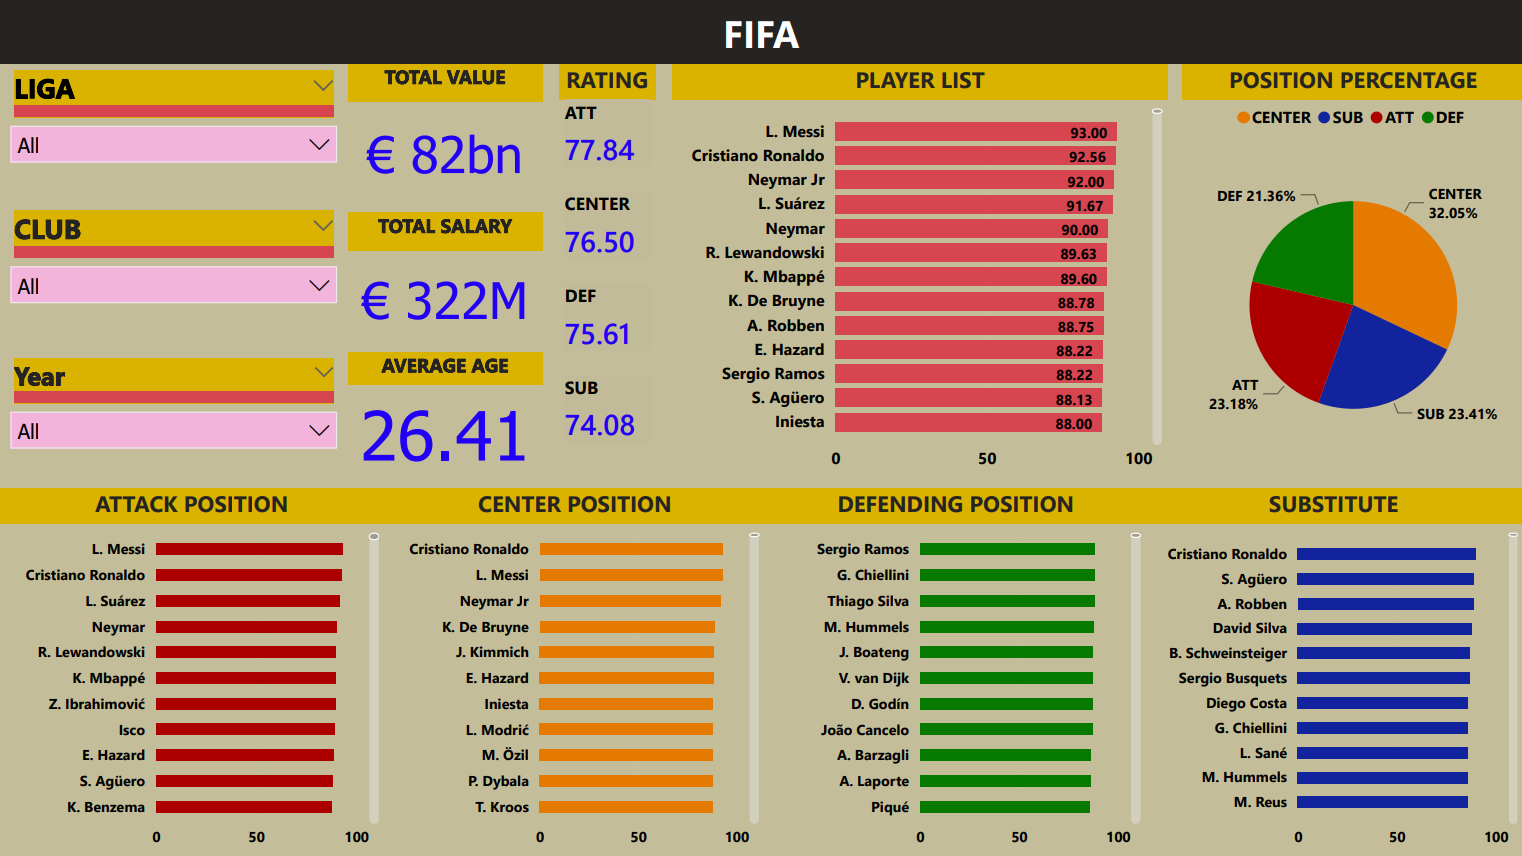
Processing of FIFA 2023 data sourced from kaggle with statistical conclusions on football players, the data was taken from 2014 - 2022, the data was processed using Python and then visualized using Microsoft Power BI.
Demo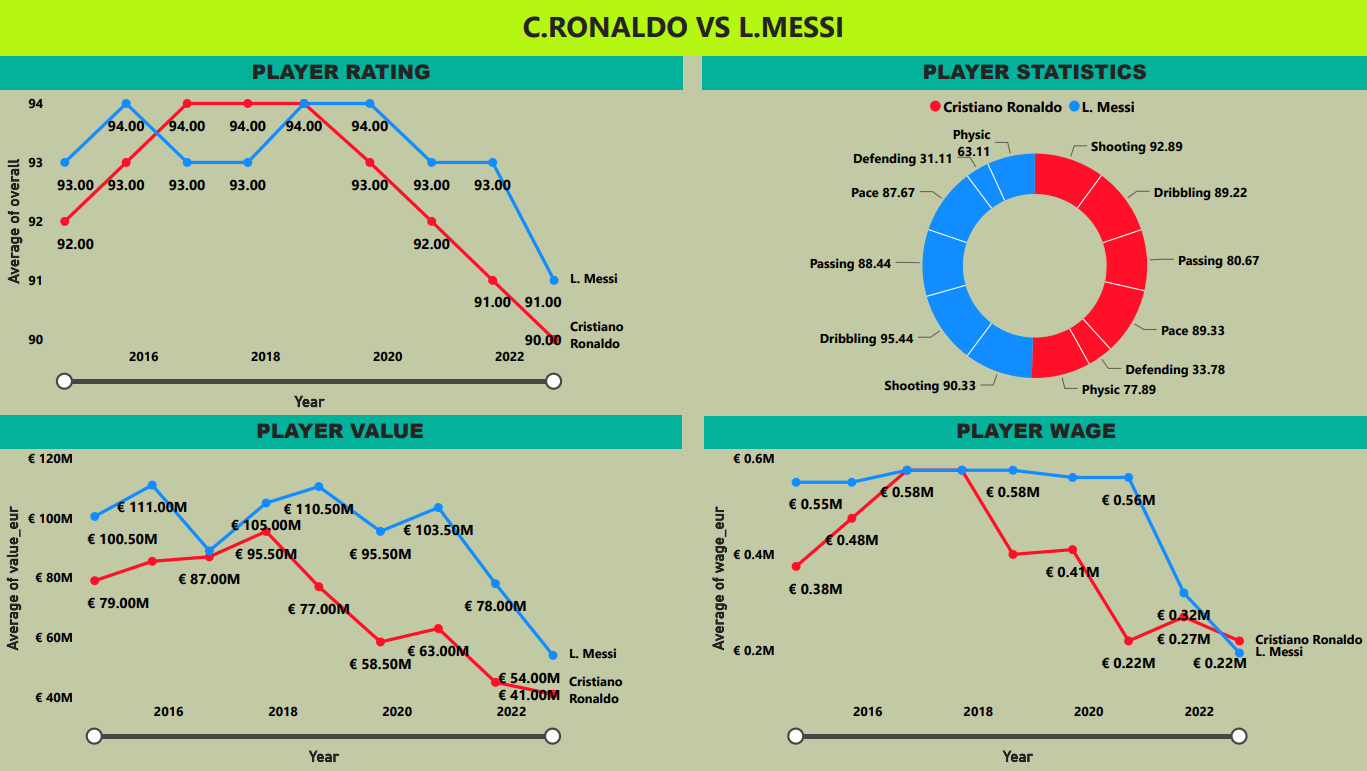
Processing of FIFA 2023 data sourced from kaggle with the conclusion of a statistical comparison of Ronaldo and Messi, data was taken from 2014 - 2022, the data was processed using Python and then visualized using Microsoft Power BI.
Demo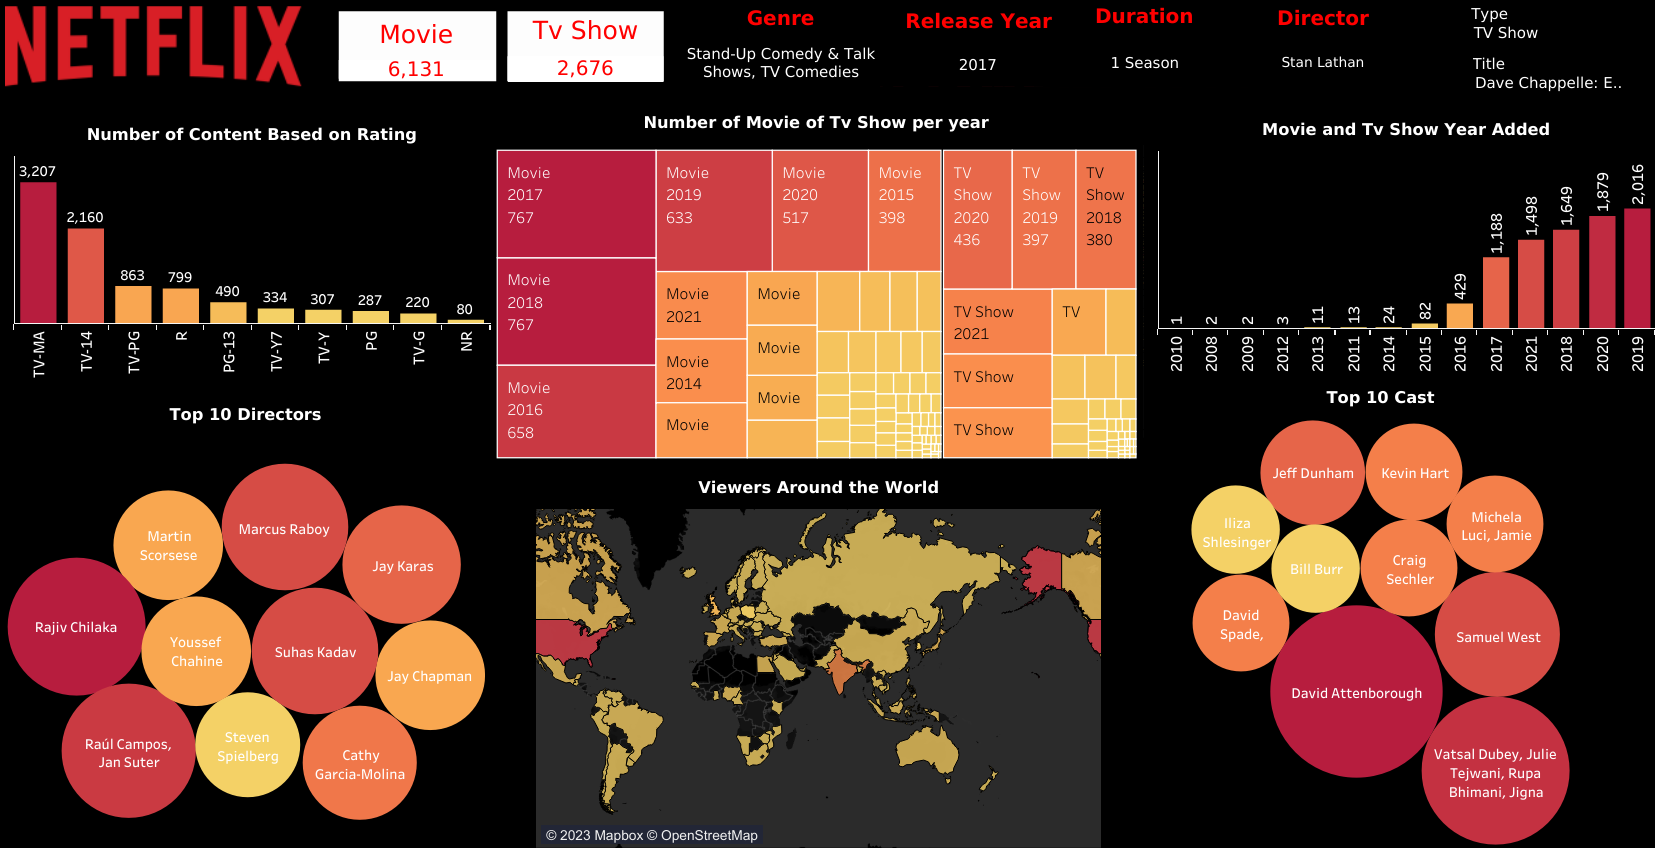
Data processing for one of the digital media streaming service providers, namely Netflix, which there are 2 types of shows, namely movies and tv shows, with more than 8000 contents which aired from 2008 – 2021, with films or TV shows released since years 1925 – 2021, data is processed using Excel and Python, then visualized using Tableau.
Demo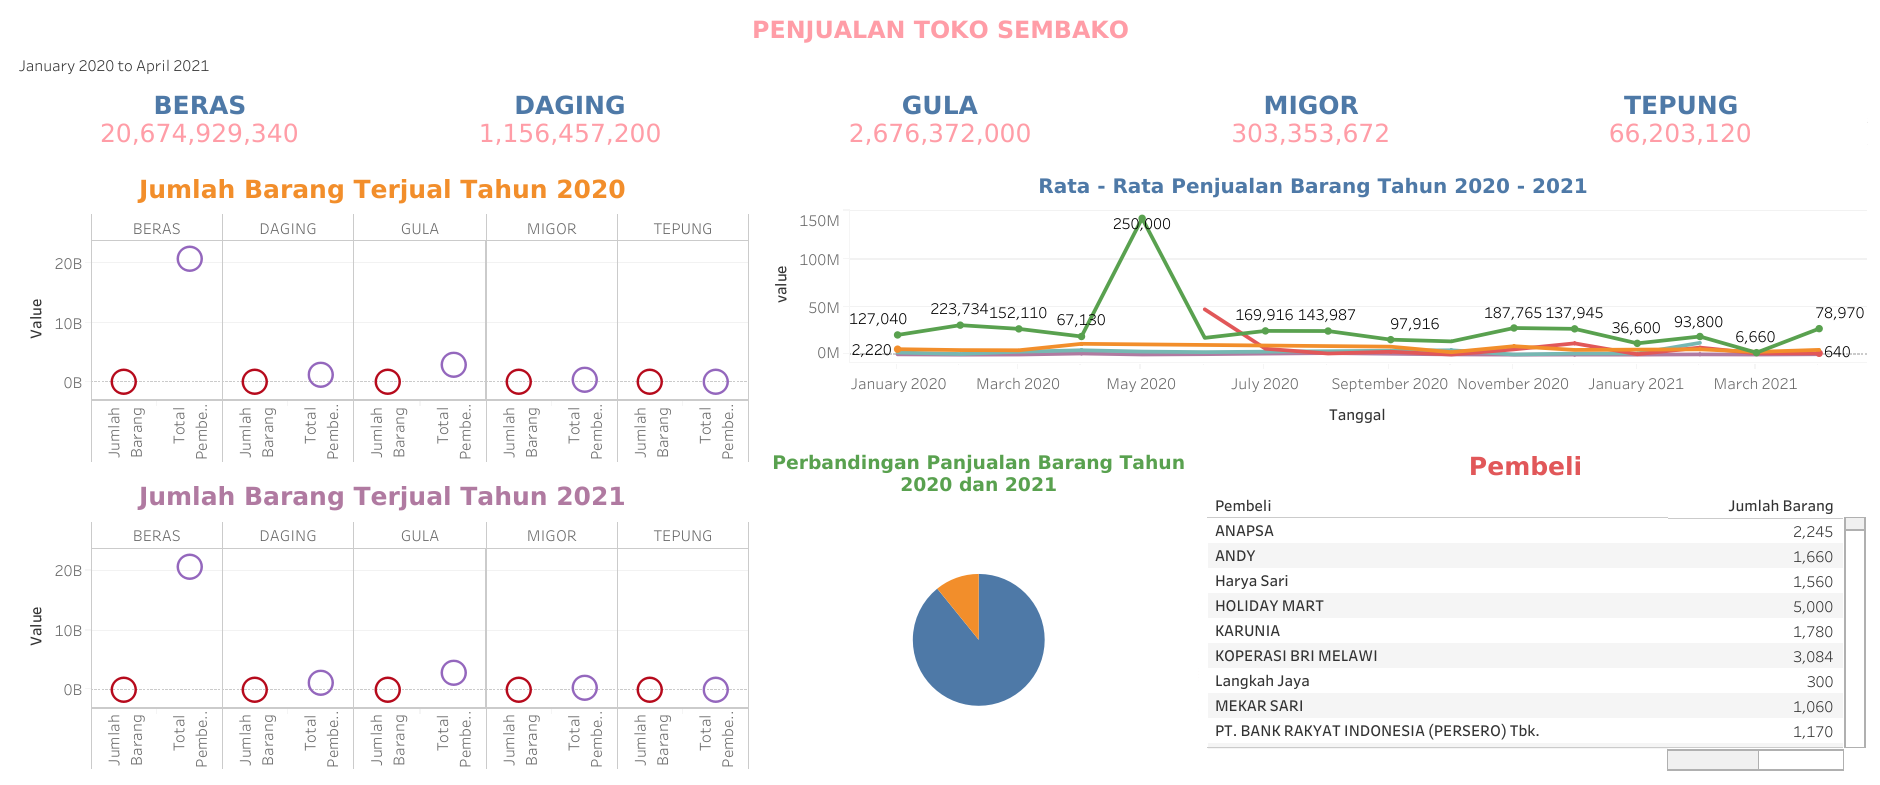
Data processing sourced from Kaggle with processing using Ms Excel and MySQL and then visualized using Tableau.
Demo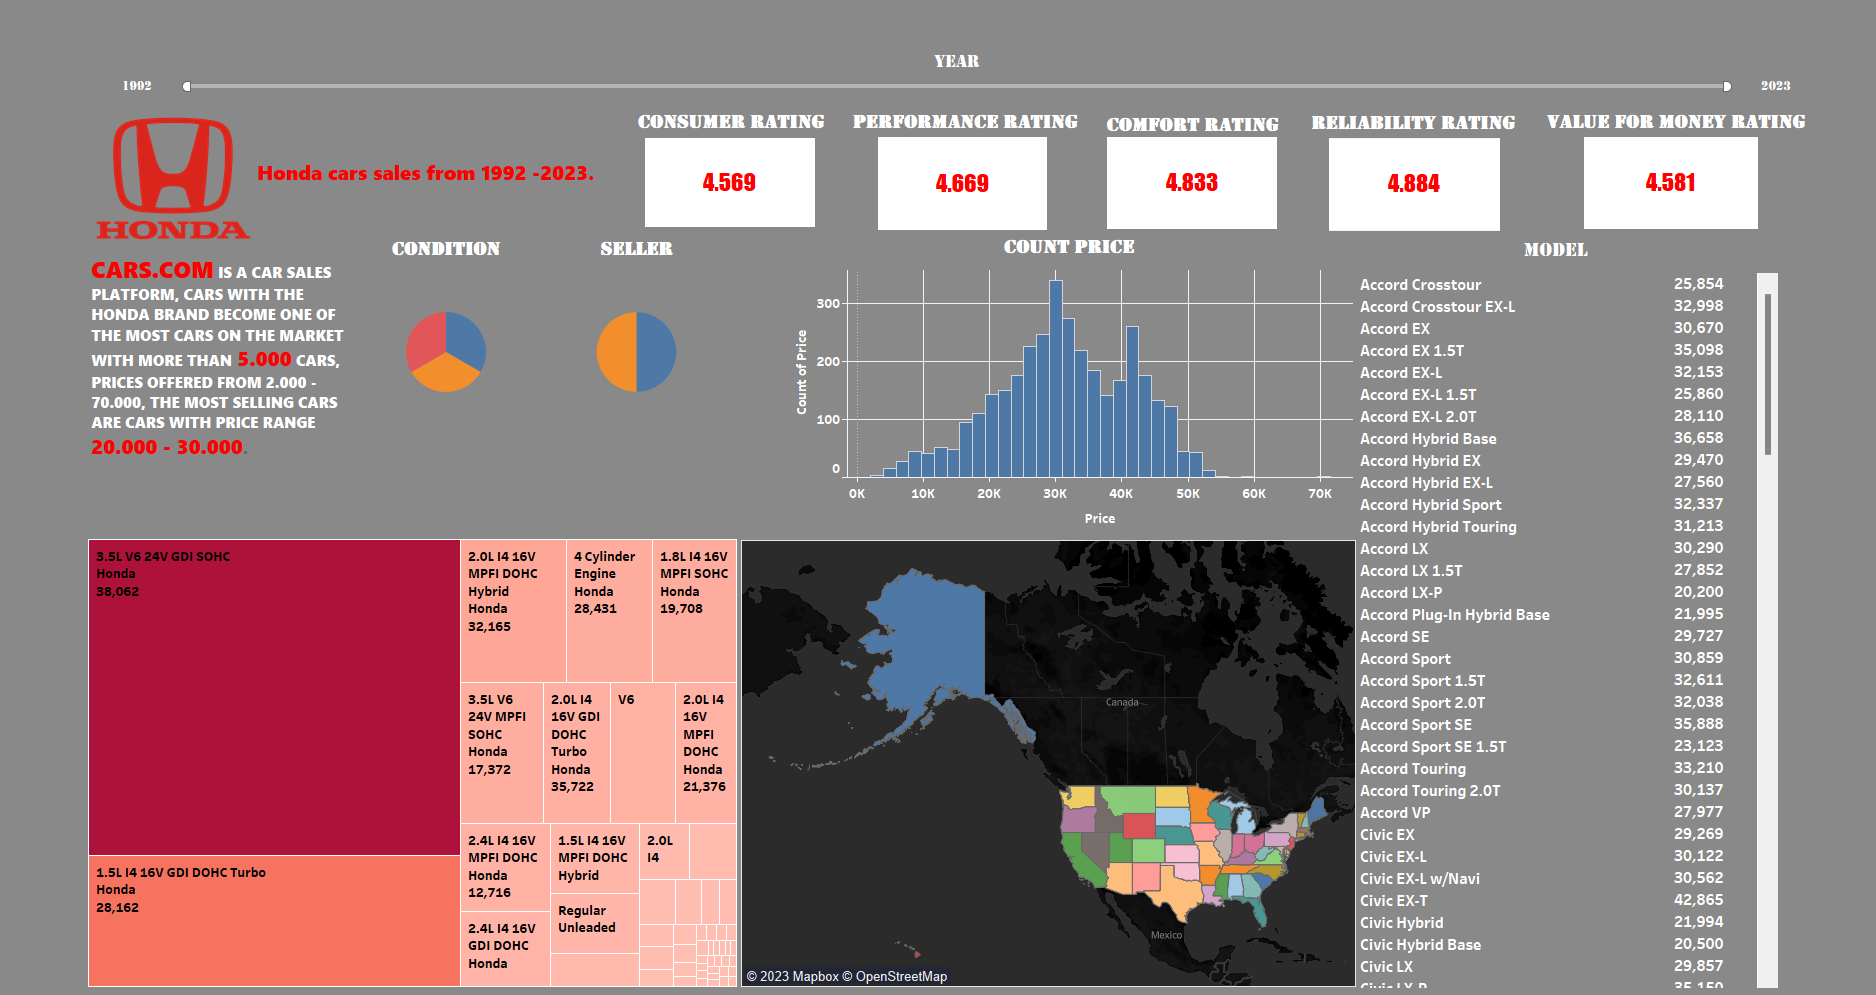
Data processing of sales of Honda brand cars on a car trading site named Cars.com, there are more than 5000 cars with the Honda brand traded starting from cars released in 1992 – 2023, data processed with using Excel, Python and MySQL, then visualized using Tableau.
Demo